


Why the Revenue Cycle Process Varies Across Healthcare Locations and How Outsourcing Can Improve Consistency
See why the Revenue Cycle Process varies across healthcare locations and how leaders can standardize workflows, reduce gaps, and improve financial performance.
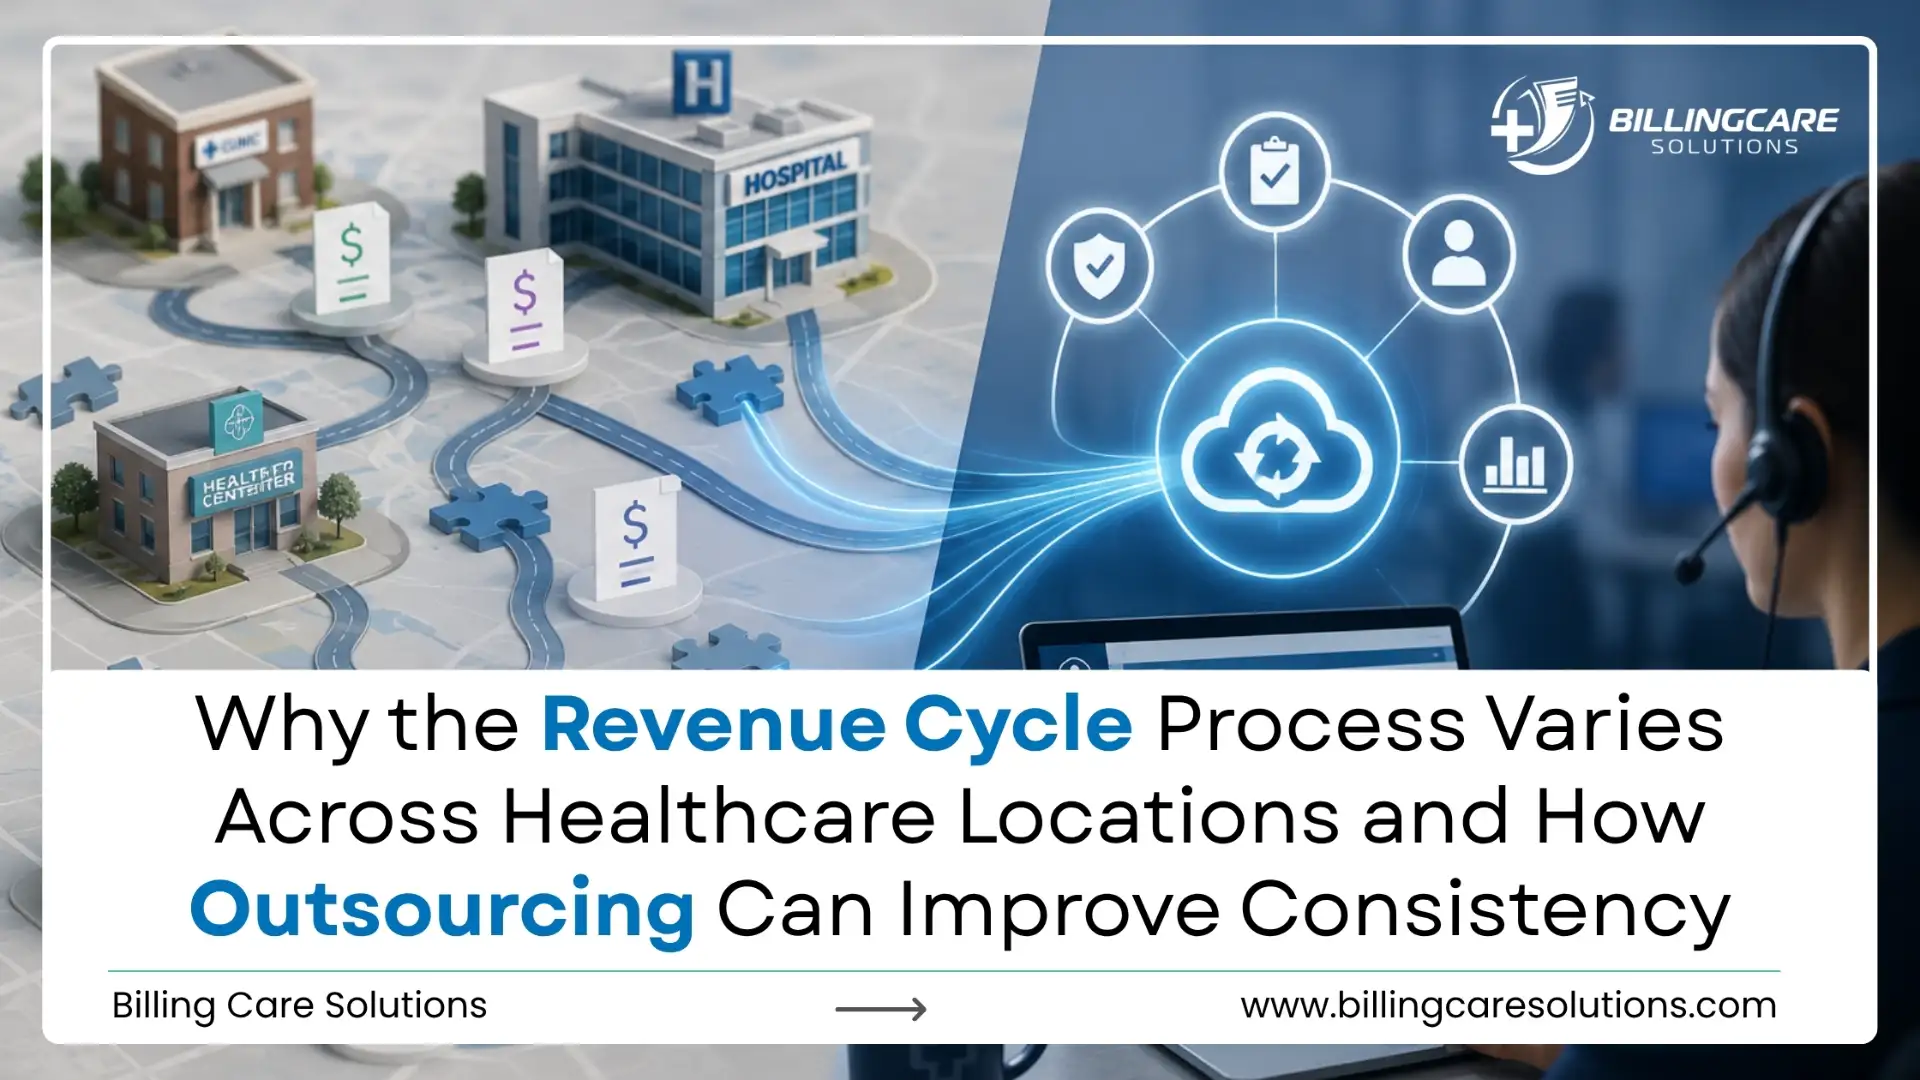
Most healthcare businesses have a standardized Revenue Cycle process that is followed at all offices. However, there are sometimes significant variations in the financial results of facilities, practices and regional operations. One location may have more “clean” claims than another may have more aged A/R. A third could see more denials for authorizations, even when they utilize the same EHR and corporate billing policies. There are significant differences that make this a challenging question for CFOs and revenue cycle leaders.
The problem is not normally caused by a single billing error. Each individual facility will shape the Revenue Cycle process through its staffing levels, the mix of providers, local workflows, provider documentation practices, technology use, and management oversight. The financial significance of this problem is reinforced by current evidence in the industry. The Savista 2025 RCM Benchmark Survey revealed that 53% of organizations surveyed indicated that they did not think that the performance of their RCM would improve without improvements. The same survey revealed that 97% outsourced one or more RCM functions, averaging 2.2 functions outsourced.
There are also issues in the overall Revenue Cycle process that are discovered through location-level differences. Where organizations operate from multiple locations, leaders require uniformity, a more consistent level of performance and more effective financial management.
Why Does RCM Performance Differ Across Locations?
The variability at the location level typically occurs over a series of operational differences and not because of one failure. One site may have billing staff trained in that area that can solve payer problems in a timely manner, and the other may have a high turnover of staff members, and may not have billing personnel trained in that area. Local flows also develop differently. When corporate procedure doesn’t match with the everyday load of the teams, they usually develop work arounds. While those workarounds may ease day-to-day pressures for employees, they can lead to variations in claims, denial, and A/R processes.
There is also variation among providers when it comes to how providers document. As documentation varies, so does the impact on the accuracy of coding, charge capture, authorization support, and claim readiness. There’s also the “patient volume” factor. The location should have sufficient capacity for timely billing and follow up at high volume. When there is insufficient staffing or work queues are not consistently managed, the volume of work can easily begin to build up. These differences mean the Revenue Cycle process exists within the same organization but operates differently at each location.
Where Does Location-Level Revenue Leakage Begin?
Revenue leakage often starts before a claim reaches the payer. Registration errors, incomplete insurance information, missing authorizations, and documentation gaps create problems that become more expensive later.
The major control points include:
- Patient registration
- Eligibility verification
- Prior authorization
- Charge capture
- Coding
- Claim submission
- Payment posting
- Denial management
- A/R follow-up
- Underpayment recovery
Each stage affects the next one. A missed authorization can create a denial. A coding problem can delay payment. A payment posting error can distort A/R reporting. CAQH found that providers and staff spent an average of 24 minutes requesting authorization through phone, fax, or email. Portal-based requests averaged 16 minutes. CAQH also identified complex plan requirements and inconsistent data as factors increasing administrative burden. This makes authorization performance particularly important for locations handling complex payer requirements. Leaders should determine where administrative effort is highest before redesigning the Revenue Cycle process across locations.
Why Do Standard Policies Produce Different Results?
When a corporation adopts a billing policy, it sets an expectation. Does not ensure normal execution. Training may be of varying quality from one site to the next. For some teams, structured education and periodic audits occur, while others have informal knowledge transfer. There’s also differences in how management attention is allocated, with some leaders monitoring trends in denial weekly and others primarily monthly financial results.
Technology usage creates another source of inconsistency. Employees sometimes create manual processes when system workflows do not fit local requirements. Over time, those workarounds become normal operating practices. The result is a gap between policy and execution.
For executives, this distinction matters because rewriting a corporate policy will not fix a problem caused by inconsistent implementation. Leadership first needs to identify where employees depart from the intended Revenue Cycle process and why. Consistent training also helps employees follow the Revenue Cycle process without developing location-specific workarounds.
How Does Payer Mix Distort Location Comparisons?
Location comparisons become misleading when leadership ignores payer composition. Two sites with similar revenue volumes might face completely different administrative requirements because their payer populations differ. There are various reimbursement and administrative requirements for commercial plans, Medicare, Medicaid, and Medicare Advantage. The guidelines regarding authorization rules, documentation guidelines, claim edits, and appeals are also different among payers.
A location with a more complex payer mix might therefore show higher administrative workload without having poor internal performance. The solution is not to eliminate payer-driven differences. It is to separate payer-driven variation from preventable operational variation. Leadership should compare locations with appropriate context. The Revenue Cycle process should then be evaluated against payer-specific requirements rather than a single organization-wide assumption. This comparison helps leaders determine whether payer complexity or the Revenue Cycle process drives the performance gap.
How Do Staffing Differences Affect Revenue Performance?
Staffing differences often become financial differences. Billers who have been working for years are familiar with the payer behavior, typical denials, coding needs, and the appeals process. Those employees go and organizations lose operational knowledge which takes time to be replaced. Vacancies also add to the workload of those who are still on the job. Large claim volumes teams may only work on new claims instead of old A/R accounts.
For perspective on this challenge, here is a snapshot of how the 2025 Savista survey came in. 53% of 115 hospital and health system leaders surveyed indicated that performance would deteriorate if they did nothing to improve RCM. The report highlighted the key challenges for organizations including staffing challenges, claim denials, outsourcing, automation and workforce optimization. This supports a broader B2B concern. Healthcare organizations need a Revenue Cycle process that does not depend entirely on the staffing stability of each individual location. Standardized staffing controls also help protect the Revenue Cycle process during periods of turnover.
Which Metrics Reveal Location-Level Performance Gaps?
CFOs need common definitions before comparing locations. Otherwise, two locations might calculate the same KPI differently and create misleading comparisons. The HFMA’s MAP Keys are a set of operational KPIs that enable hospitals, health systems, ambulatory providers, physician groups, post-acute care and integrated delivery systems to compare their revenue cycle statistics. It includes patient access, pre-billing, claims, account resolution and financial management.
| KPI | What It Measures | Executive Use |
|---|---|---|
| Clean Claim Rate | Claims passing edits without manual intervention | Identifies claim-quality issues |
| Initial Denial Rate | Claims denied during initial adjudication | Measures denial exposure |
| Denial Write-Offs | Denied revenue ultimately written off | Shows permanent revenue loss |
| A/R Aging | Outstanding balances by age | Identifies collection risk |
| Denial Resolution Time | Time needed to resolve denials | Measures recovery speed |
| Denial Overturn Rate | Denials successfully reversed | Evaluates appeal effectiveness |
| Cost to Collect | RCM expense relative to collections | Measures operating efficiency |
These metrics give leadership a consistent measurement framework. Each location should report these metrics using the same Revenue Cycle process definitions. HFMA specifically recommends standardized denial measures such as initial denial rate, denial write-offs, appeal timing, resolution timing, and denial overturn rates. The next step is to use those metrics consistently across every location.
What Does Current Industry Data Show About Denials?
Denial performance provides one of the clearest indicators of revenue cycle friction. Current industry research shows why leadership should treat denial management as a financial control rather than a back-office task.
The following figures provide external context for executive planning.
| Industry Measure | Reported Result | Period |
|---|---|---|
| Initial claim denial rate | 11.81% | 2024 |
| Initial claim denial rate | 11.5% | 2023 |
| Prior authorization request by phone, fax, or email | 24 minutes | 2024 CAQH Index |
| Prior authorization request through payer portal | 16 minutes | 2024 CAQH Index |
| Organizations expecting declining RCM performance without change | 53% | 2025 Savista |
| Organizations outsourcing at least one RCM function | 97% | 2025 Savista |
| Average RCM functions outsourced | 2.2 | 2025 Savista |
Kodiak’s reported denial data provides the initial claim denial figures, while CAQH provides the authorization workload data. Savista provides the outsourcing and RCM leadership findings. These sources measure different populations and should not be treated as one combined benchmark. The practical takeaway is more important than a single benchmark. Organizations need consistent Revenue Cycle process controls because denial pressure and administrative workload affect cash performance.
How Much Revenue Can Location Variation Put at Risk?
Small percentage differences become significant when applied to large revenue bases. CFOs should therefore translate operational gaps into dollar exposure instead of reviewing percentages alone. Consider a location generating $2 million in monthly net patient revenue. A five percentage-point collection gap represents $100,000 in monthly exposure.
| Illustrative Financial Calculation | Amount |
|---|---|
| Monthly net patient revenue | $2,000,000 |
| Collection performance gap | 5 percentage points |
| Monthly revenue exposure | $100,000 |
| Twelve-month exposure | $1,200,000 |
This is an illustrative calculation, not an industry benchmark or expected recovery figure. The actual financial exposure depends on payer contracts, collectible revenue, denial causes, underpayments, patient balances, and write-off policies. CFOs should connect these financial differences to specific weaknesses within the Revenue Cycle process. A small percentage gap at a low-volume site might deserve limited attention, while the same gap at a high-volume location might warrant immediate intervention.
When Does Location Variation Require Executive Intervention?
Not every performance difference represents a process failure. Patient populations, specialties, payer mix, service volume, and reimbursement contracts naturally create variation. The concern begins when differences remain persistent and unexplained.
Leadership should investigate when one location repeatedly shows:
- Higher denial volume
- Lower clean claim performance
- Growing aged A/R
- Slower denial resolution
- Higher denial write-offs
- Delayed claim submission
- Repeated authorization failures
- Lower collection performance
- Rising billing backlogs
The investigation should identify the underlying cause before management changes the operating model. A location might need additional staff. Another might need coding oversight. A third might have a payer-specific authorization problem. The right intervention depends on the cause of the performance gap, not the size of the location alone.
Which RCM Functions Should Be Standardized?
Not every function requires identical centralized execution. Leaders should determine which activities benefit most from common procedures, centralized expertise, and shared accountability.
Functions that often benefit from stronger standardization include:
- Coding quality review
- Claims submission
- Denial categorization
- Denial appeals
- A/R prioritization
- Payment posting controls
- Underpayment identification
- KPI reporting
Local teams might still handle provider communication, operational coordination, and location-specific workflow issues. This creates a hybrid operating model. Central teams manage functions where consistency has financial value, while local teams retain responsibilities requiring direct operational knowledge. The goal is to create a Revenue Cycle process with consistent controls without removing every local decision.
How Outsourcing Can Improve Consistency
Outsourcing improves consistency when it creates one measurable operating framework across locations. The benefit does not come from moving billing tasks to an external company by itself. A qualified RCM partner can establish common procedures, centralized quality controls, specialized resources, and shared reporting standards. This reduces dependence on individual location practices and makes operational differences easier to identify.
The consistency mechanisms include:
- Standard operating procedures
- Centralized billing workflows
- Common denial categories
- Structured A/R work queues
- Shared escalation rules
- Centralized quality audits
- Location-level dashboards
- Consistent staff training
- Common productivity standards
Centralized oversight gives leaders greater control over how the Revenue Cycle process operates across locations. Instead of receiving separate reports with different definitions, executives receive comparable information across locations. The financial value then depends on whether standardized processes produce measurable improvements.
How Does Outsourcing Close Location-Level Performance Gaps?
Outsourcing should address the cause of the performance gap rather than simply absorb the existing workload. Consider two locations within the same healthcare organization. Location A has experienced staff and disciplined A/R follow-up. Location B has higher turnover, authorization problems, and growing aged balances. A centralized RCM team can review both locations using the same operational standards. It can identify whether Location B’s problem comes from staffing, authorization, coding, claim submission, or A/R follow-up.
The organization can then apply a consistent workflow while maintaining location-level reporting. This approach changes the leadership conversation. Instead of asking why one location collects less, executives can identify the specific process producing the difference. That makes outsourcing a potential operating-model solution rather than a simple labor replacement strategy.
What Should CFOs Measure After Outsourcing?
Outsourcing should begin with documented baselines. Leadership needs to know how each location performs before measuring post-transition results.
The following framework separates the baseline from the outcome being evaluated.
| KPI | Baseline Question | Post-Outsourcing Question |
|---|---|---|
| Initial Denial Rate | How often are claims initially denied? | Has denial frequency changed? |
| A/R Aging | How much A/R sits in older buckets? | Are older balances declining? |
| Denial Write-Offs | How much denied revenue becomes unrecoverable? | Are write-offs declining? |
| Denial Resolution Time | How quickly are denials resolved? | Is resolution becoming faster? |
| Denial Overturn Rate | How often are appeals successful? | Is recovery effectiveness improving? |
| Cost to Collect | What does current RCM operation cost? | Is collection efficiency improving? |
These measures should use consistent definitions before and after outsourcing. HFMA’s framework emphasizes standardized calculations because organizations need reliable data for benchmarking and process improvement. CFOs should also compare individual locations against one another. An organization-wide improvement might still hide a poorly performing site. Post-outsourcing reporting should show whether the Revenue Cycle process is becoming more consistent across locations.
What Should CFOs Look for in an RCM Partner?
Vendor evaluation should focus on operating capability rather than service volume. A partner supporting multiple healthcare locations needs systems for centralized management, location-level reporting, payer-specific expertise, and performance accountability.
| Evaluation Area | What Leadership Should Verify |
|---|---|
| Multi-location experience | Similar distributed healthcare operations |
| Payer expertise | Experience with relevant payer requirements |
| Coding | Specialty-specific quality controls |
| Denial management | Root-cause analysis and appeal processes |
| A/R management | Structured aging and account prioritization |
| Reporting | Location-level financial visibility |
| Technology | EHR and billing system integration |
| Compliance | Documented billing and privacy controls |
| Scalability | Capacity for volume and location growth |
| Accountability | Defined KPIs and review cadence |
The evaluation should also include implementation responsibilities. Ask who owns workflow redesign, data validation, training, escalation, reporting, and performance reviews. A vendor that reports only total collections gives limited visibility. CFOs need to understand how each location performs and why.
What Should the First 90 Days Look Like?
The first 90 days should focus on measurement, standardization, and controlled improvement.
Days 1 to 30
Establish baseline performance for every location.
Review:
- A/R aging
- Denial categories
- Clean claim rates
- Days to bill
- Collection rates
- Staffing capacity
- Workflow differences
Identify the locations with the largest unexplained gaps.
Days 31 to 60
- Standardize priority workflows.
- Create consistent rules for denial management, A/R follow-up, coding review, claim submission, and escalation.
- Align reporting across locations.
Train teams on the standardized Revenue Cycle process.
Days 61 to 90
Measure early performance changes.
- Compare location results against baseline metrics.
- Review unresolved bottlenecks.
- Analyze denial trends.
- Reprioritize high-value A/R.
- Establish ongoing performance reviews with leadership.
This approach gives executives measurable evidence instead of relying on vendor promises.
How Billing Care Solutions Supports Consistent RCM Performance
Billing Care Solutions supports healthcare organizations seeking greater consistency across their Revenue Cycle process. For multi-location organizations, the focus should remain on standardized execution, location-level visibility, and financial accountability. Billing operations should connect daily workflows with the KPIs leadership uses to evaluate performance.
Support areas include:
- Medical billing
- Claims management
- Coding support
- Payment posting
- Denial management
- A/R follow-up
- Revenue reporting
- KPI monitoring
- Quality control
A structured model helps leadership compare locations using consistent operational standards. It also provides a framework for identifying where financial performance differs and where corrective action is needed. The objective is to create a Revenue Cycle process that remains measurable as the organization adds locations, staff, providers, and patient volume.
Conclusion: Build Consistency Across Every Location
Healthcare organizations should expect some financial variation between locations. Different payer populations, specialties, service volumes, and contracts naturally affect performance. Persistent unexplained variation is different. Repeated denial problems, aging A/R, inconsistent claim quality, and uneven follow-up often indicate operational differences leadership needs to address.
Industry evidence shows why this deserves executive attention. HFMA’s standardized KPI framework gives organizations a consistent way to measure revenue cycle performance, while Savista’s 2025 survey shows widespread use of selective RCM outsourcing among healthcare organizations. For CFOs, the first step is measurement. Compare locations using consistent definitions, financial metrics, and operational data before deciding how to intervene.
Outsourcing becomes a viable solution in cases where in-house teams are unable to perform consistently across locations. The best model is one that includes standardized processes, specialized knowledge, centrally managed processes, and location accountability. The goal is not to make every healthcare location identical. The goal is to build a Revenue Cycle process that produces consistent, measurable, and financially controlled performance as the organization grows.
