


Are Your RCM Results Actually Competitive? The Revenue Cycle Benchmarks CFOs and RCM Directors Need to Know
See how your RCM results compare with revenue cycle benchmarks for denials, A/R, collections, and clean claims. Find the gaps costing revenue.
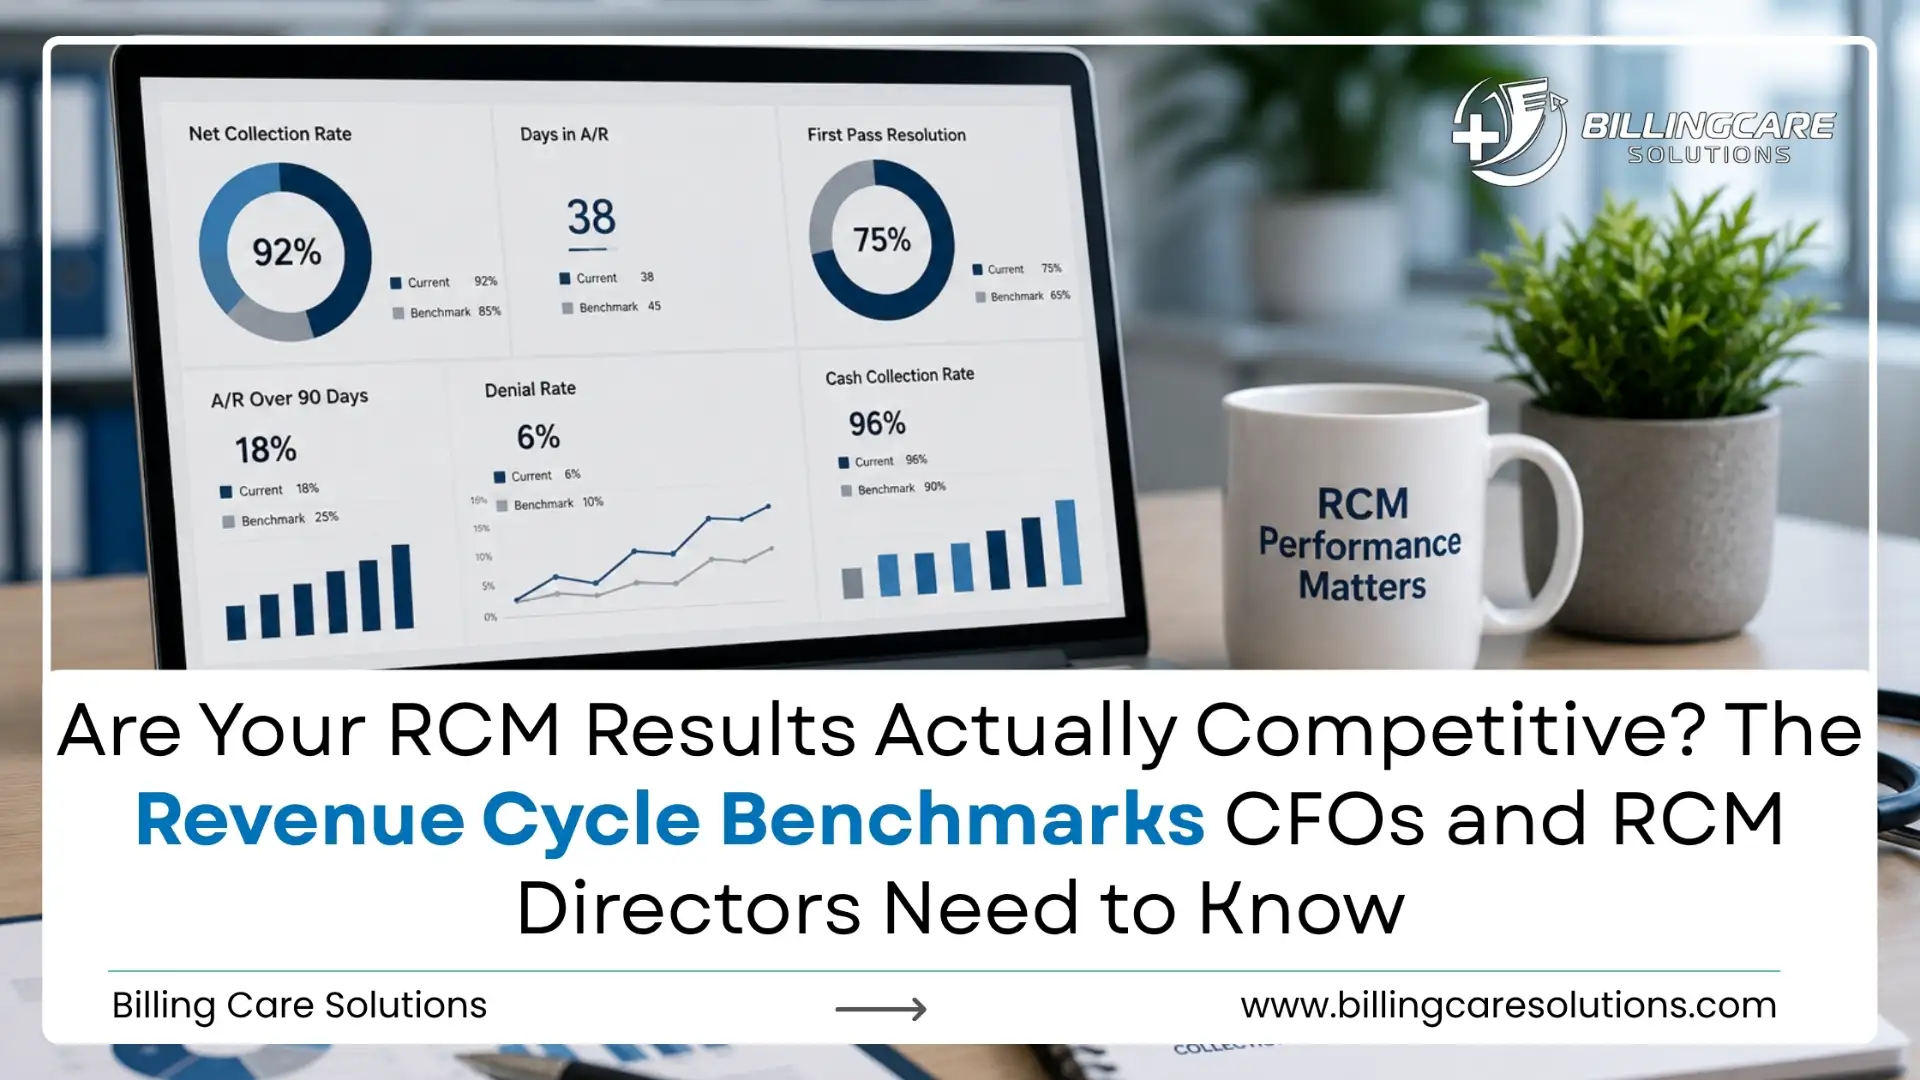
The revenue cycle impacts cash flow, profitability and financial forecasting directly. But, numerous healthcare institutions look at RCM metrics without benchmarking them to the appropriate revenue cycle benchmarks. While a 95% clean claim rate may seem impressive, it may actually lead to significant revenue leakage if there are high denial rates or if A/R is aged. There’s a need for CFOs and RCM Directors to have a wider lens on performance. They should look at claims, collections, a/r, denials and operating costs as a whole. Most importantly, they must be aware of whether their performance is competitive for their specialty, in terms of their mix of payers and care settings.
Those comparisons are made using the revenue cycle benchmarks. They support leadership in recognizing any performance gaps, in quantifying the financial risk exposure and in deciding on processes to be looked into for RCM. This guide explores the most important revenue cycle metrics healthcare leaders should track. It also provides guidance on how to measure performance, measure gaps in the benchmarks and identify improvements that are worth prioritizing.
Why Revenue Cycle Benchmarks Matter in 2026
Revenue cycle benchmarks provide CFOs and RCM Directors with a standardized standard on which to measure revenue cycle performance. An organization could take substandard results without question if the numbers are not changing drastically. Benchmarking helps to place those numbers into context and identify where performance is below a relevant peer. With smaller profit margins and increasingly complex reimbursement rules, the demand for improved revenue cycle benchmarks has grown. Revenue cycle issues are impacted by payor rules, authorization needs, staffing expenses, and late payments. Leaders need to have indicators that link activity with results that have actual financial consequences.
Suppose a practice is making $2 million per month. If collection drops by 2 percentage points, it means that $40,000 is being lost in monthly revenue. If that lack of recovery occurs over the course of a year, that deficit is $480,000 a year.
There are three questions that CFOs would like to find an answer for using revenue cycle benchmarks:
- What is not working so well?
- What is the impact of the gap on revenue?
- What is the problem with the RCM process that is causing the gap?
This way, you can use revenue cycle benchmarks as a tool for financial management. Rather than assessing individual KPI changes, leadership can focus on areas that would benefit from revenue exposure improvement.
Which Revenue Cycle Benchmarks Should CFOs Track?
CFOs don’t have to have the definition of these common revenue cycle benchmarks down pat. They require a structure that indicates what measures may give useful information about financial performance. The best-in-class scorecard uses a mix of claims quality, revenue recovery, cash velocity and operating efficiency.
| RCM Area | Key Benchmarks | Why CFOs Track Them |
|---|---|---|
| Claim quality | Clean claim rate, first pass resolution | Identifies front-end leakage |
| Revenue recovery | Net collection rate, denial rate | Measures collectible revenue |
| Cash velocity | Days in A/R, A/R over 90 days | Shows cash conversion |
| Cost efficiency | Cost to collect, staff productivity | Measures operating efficiency |
These metrics should not be used individually as a scorecard item, but should be considered together. If the claims are too old, this doesn’t make them good. Similarly, if collections are down at the same time RCM costs are low, then the lower RCM costs don’t mean they are better. These revenue cycle KPIs can show a connection between them that can identify issues that individual KPIs might not detect. An increase in A/R with stable clean claim performance may be a sign of follow-up issues or payer delay, not front-end claim issues.
Revenue Cycle Benchmarks That Drive Financial Performance
Revenue cycle benchmarks are more meaningful if there is a link between leadership and financial outcomes. The aim is not to get a random number. The aim is to identify if there is a revenue leakage, cash delay or over operating expense due to the existing performance.
Benchmark Cash Velocity, Not A/R Alone
Days in A/R become more useful when paired with aging distribution and collection trends. Stable AR reporting of 42 days could be hiding a problem with 20% of the receivables being more than 90 days old. This old-time focus increases exposure to collection and reduces cash that is expected to be used for other purposes. In addition to aging buckets, payer-specific delinquency periods, and monthly collection performance, CFOs should take a look at overall A/R. They should also determine if older balances are attributed to certain payers, services or operational flows. This can help differentiate between normal timing of reimbursement and the structural cash-flow issue.
Measure Revenue Recovery Against Expectations
Net collection performance determines if the organization is collecting the amount that it justifiably believes it will receive. If the rate of decline is becoming less but the gross collections are still rising, it should be explored. The organization may be taking in more dollars but a smaller percentage of the dollars that flow to them.
Track and analyze collections by payers, locations, payment specialty and provider. This segmentation can reveal under payments, inconsistencies in adjustments, contract problems, or poor follow up that combines to hide the results.
Measuring collection performance against revenue cycle benchmarks, when tied to expected reimbursement, is now meaningful. This provides CFOs with a more detailed understanding of the cash leakage points in their expected revenue.
Separate Preventable From Structural Denials
At 5%, that rate of denial isn’t enough to make any financial decisions. Leaders must recognize that denials that are preventable are not necessarily caused by a payer processing problem, and that other factors are not under the control of the leader. The difference is what helps to identify the most likely places for measurable recovery with operational investment. Separate the following types of authorization, eligibility, coding, documentation, medical necessity and payer processing issues: Then work out the dollars of each category. There may be more merit to a smaller denial category with the high dollar claims than a larger category with low dollar services.
Connect Claim Quality With Cash Performance
Clean claims should provide for quicker payment and reduction in administrative rework. Strong clean claim rates are not necessarily accompanied by strong overall revenues, though. Clean claims and rising A/R may be a problem later in the cycle. Examine payers’ turnaround, payment variation, follow-up success, and unpaid claims, in addition to claim quality. A broader perspective allows leadership to decide if the issue is in claim submission, payer processing, payment posting, or collections.
Benchmark Cost Against Revenue Recovered
Fewer resources used in RCM does not necessarily mean better financial results. Obviously, a less costly operation that results in a significant portion of collectible revenue being lost gives the false impression of efficiency. CFOs should compare operating costs with the amount of revenue they’re able to recover by using those processes. Analyze cost of collection with net collections, denial recovery, staff productivity and A/R movement. Revenue cycle benchmarks must, therefore, measure efficiency and the financial recovery. The goal should be efficient revenue recovery, not minimum billing costs.
What Does Competitive RCM Performance Look Like?
A benchmark is only valuable if leadership understands what good performance is. Revenue cycle benchmarks should be used for reference only, not to deter or discourage.
| RCM Metric | Common Reference Range | Strong Performance |
|---|---|---|
| Clean Claim Rate | 90% to 95%+ | Above 95% |
| Denial Rate | 5% to 10% | Below 5% |
| Days in A/R | 40 to 50 days | Below 40 days |
| A/R Over 90 Days | 15% to 25% | Below 15% |
| Net Collection Rate | 90% to 95% | Above 95% |
| Cost to Collect | 3% to 5% | Below 3% |
While these are good management reference numbers, they shouldn’t be a universal rule. A complex specialty that has a lot of authorization requirements may well be in operation in a different way to a primary care organization. The revenue cycle benchmarks are applicable to specialty, payer mix, and the complexity of services provided, as well as the care setting. Wherever possible, CFOs should compare results with other similar organisations.
Trends of internal performance should also be considered. An organisation with a 9% denial rate and an external target of under 5% is making measurable progress towards its external target, even if it is currently not meeting it. The best revenue cycle benchmarks, then, are ones that take the external benchmarking and overlay it with internal trend analysis. This provides leadership with a better understanding of improvement or declines in performance.
Why Revenue Cycle Benchmarks Vary by Specialty
One benchmark cannot be used as an accurate comparison for all healthcare organizations. Revenue cycle benchmarks vary by specialty, payer mix, service complexity, reimbursement models and care settings. The time it takes to process a specialty vs. primary care is different because of prior authorization needs. Commercial and government payers have different reimbursement patterns, and this relationship is further complicated by the volume of commercial payers an organization has.
| Variable | Why It Changes RCM Results | Benchmarking Approach |
|---|---|---|
| Specialty | Coding and billing complexity vary | Compare similar specialties |
| Payer mix | Payment rules and turnaround times differ | Segment results by payer |
| Service mix | Complex services affect A/R | Compare similar service lines |
| Care setting | Workflows differ by setting | Use setting-specific benchmarks |
| Contract structure | Reimbursement terms affect collections | Review payer performance |
Payer-level analysis is especially important when evaluating revenue cycle benchmarks. An overall 45-day A/R might appear reasonable while one payer consistently takes longer to reimburse. The aggregate result hides the operational issue. The same principle applies to denials. A specialty might experience higher denials because its claims require more authorization and medical necessity review. That does not automatically indicate poor RCM performance.
The objective is to compare your results with the right peer group and identify gaps within your control. This creates more credible targets and prevents leadership from investing resources based on misleading comparisons.
How to Tell If Your RCM Results Are Underperforming
A benchmark gap isn’t automatically an indicator of sub-optimal performance in your RCM operation. Leadership must decide if the variation is recurring, focused, substantial and manageable. It is best to begin with the past. Even if the external target is still under 5%, a rate of 6% is a step in the right direction for an organization that had a 9% denial rate. The trend is important to take into account when assessing the present outcome.
Next, segment performance by payer, specialty, location, provider, and service line. Aggregate results often hide concentrated problems. One payer might account for most delayed payments while overall A/R remains within the organization’s target. Revenue cycle benchmarks should therefore be evaluated alongside the financial size of each gap. A one-point improvement on $100 million in annual claims has a different financial impact than the same improvement on $5 million.
| Diagnostic Question | What to Examine | Leadership Decision |
|---|---|---|
| Is the gap persistent? | Monthly and quarterly trends | Address structural issues |
| Where does it occur? | Payer, specialty, location | Target the affected segment |
| What causes it? | Denial and A/R root causes | Fix the underlying process |
| What revenue is exposed? | Dollars tied to the gap | Prioritize by financial impact |
| Is improvement realistic? | Internal and peer performance | Set an achievable target |
CFOs should also separate operational causes from external factors. Payer processing delays, contract terms, and reimbursement changes might affect performance without indicating an internal RCM failure. The stronger question is not whether a metric falls below target. Ask why it does, how much revenue it affects, and whether the organization can influence the outcome.
How Benchmark Gaps Translate Into Lost Revenue
A benchmark gap turns into a financial issue when it relates to collectible revenue. It is important for CFOs to look at the dollars instead of only percentage changes. This makes it easier to prioritize the financial risk when budgeting and planning operations. Take a health system with $100 million in annual claims, for example. Two points if preventable denials exceed 5% target would impact $2,000,000 in claims. All of this is not a loss of permanent revenue as some denied claims will be recovered.
The helpful calculation involves the recoverable amount of that exposure. Revenue cycle benchmarks should therefore be linked to real-life recovery rates, claim value, and aging as opposed to considering them as percentages.
| Benchmark Gap | Financial Exposure | What CFOs Should Measure |
|---|---|---|
| Higher denial rate | More revenue enters denial workflow | Recoverable denial dollars |
| Higher A/R days | Cash remains outstanding longer | Revenue tied to aging balances |
| Lower net collection rate | Expected reimbursement remains uncollected | Unrecovered collectible revenue |
| Lower clean claim rate | More claims require rework | Rework cost and delayed cash |
| Higher A/R over 90 days | Older balances face greater collection risk | Recoverability by aging bucket |
The same logic goes for collection performance. Suppose that an organisation anticipates to collect $50 million a year in collectibles revenue. With a 2 percent decline in net collection performance, there’ll be $1 million in unrealized collections. Next, leadership needs to differentiate revenue that can be recovered from structural losses. This will avoid over-estimating the opportunities and facilitate a more realistic financial planning.
The most helpful revenue cycle benchmarks provide an answer to three financial questions:
- What revenue is exposed?
- How much is realistically recoverable?
- What operational change will recover it?
Based on expected financial return and not only KPI percentages, CFOs can then rank RCM initiatives.
How RCM Teams Close Benchmark Gaps
It takes more than just a lower target to close a benchmark gap. Teams should determine the process causing variance, define the dollar cost of the variance, and determine who is responsible for its correction. Begin with the KPI that has the highest monetary exposure. A 2% denial gap may be more important than a 10% productivity gap when it involves millions of dollars in collectible revenue.
Next, divide the problem by the payer, provider, location, specialty, procedure, denial reason and aging category. This will help you to determine if it is a single stream or a wider process issue that’s causing the variance.
| Improvement Stage | RCM Action | Financial Objective |
|---|---|---|
| Identify | Isolate the benchmark variance | Quantify revenue exposure |
| Segment | Analyze payer and operational patterns | Find the highest-impact source |
| Correct | Change the underlying workflow | Reduce recurring leakage |
| Monitor | Track KPI movement | Confirm sustained improvement |
| Rebenchmark | Compare results against targets | Reset performance goals |
RCM leaders must designate owners for each of the improvement areas. Coding problems need the oversight of a coding professional, authorization problems need to be addressed by the front-end, and aging A/R needs follow-up and escalation focused on the aging account. This process should be facilitated by technology, not replace it. Teams can use dashboards, work queues, eligibility tools and denial analytics to spot issues quicker. The workflow still needs to be owned and also measurable to be held accountable for.
Once the change is put in place, record the KPI and the financial outcome. When a lower denial rate leads to higher recoveries, it leads to faster cash conversion or it leads to lower administrative costs, this is better. Great teams see revenue cycle benchmarks as a continuous management process. They recognize deficiencies, address root causes, track financial results and benchmark as operating conditions shift.
When Should You Change Your RCM Strategy?
Not all the gaps in the benchmarks need to be outsourced or a big technology investment. First it is necessary for leadership to find out if the problem exists because of a failure in internal processes that requires fixing, or because these processes have the ability and expertise. A strategy review is more critical when corrective action is not resulting in performance improvements. If a problem keeps recurring it can be a capacity problem, a weakness in the process, technology limitation or a lack of special expertise.
Common warning signs include:
- Denial rates remain above target.
- A/R over 90 days continues growing.
- Net collection performance declines.
- Payer-specific issues remain unresolved.
- RCM labor costs rise without better collections.
- Internal teams lack capacity for detailed denial analysis.
- Management lacks reliable KPI reporting.
- Benchmark improvements fail to produce financial gains.
Revenue cycle benchmarks become especially useful at this stage because they help leadership determine whether the existing operating model remains competitive. The question is not whether internal teams are capable of managing the revenue cycle. The question is whether the current model produces the required financial performance at an acceptable cost. Leadership should evaluate staffing, technology, process maturity, payer complexity, and expected recovery opportunities before changing the RCM model.
How Billing Care Solutions Improves RCM Performance
Benchmark gaps become valuable when they lead to measurable financial improvement. Billing Care Solutions helps healthcare organizations identify where RCM performance falls below target and determine what drives the variance. The process starts with performance data. Core KPIs such as denial rates, A/R aging, collection performance, clean claim rates and more are analyzed by teams against organizational benchmarks. This helps leadership know where financial performance falls short.
The next step is the process of the root cause analysis. A high denial rate may be due to errors in authorization, coding, eligibility, documentation or if the authorization is specific to a particular payer. A corrective strategy is different for each cause. Billing Care Solutions also helps segment performance by payer, specialty, provider, and service line. This prevents leadership from treating an organization-wide KPI as one problem when the variance comes from a specific segment.
The financial impact remains central throughout the process. Teams connect revenue cycle benchmarks with affected A/R, unrecovered revenue, delayed cash, and avoidable administrative costs. For CFOs and RCM Directors, this creates a clearer path from benchmark data to financial action. The objective is to improve the processes behind the numbers and measure whether those improvements translate into stronger revenue performance.
Conclusion
Revenue cycle benchmarks give healthcare leaders a practical way to evaluate financial performance. However, no single KPI provides enough information to judge an entire revenue cycle. CFOs need to look at the clean claims, denials, A/R aging, collections and operating costs side-by-side. They should also modify comparisons by specialty, payer mix, complexity of services and care settings.
The most helpful benchmarks in the revenue cycle relate operational performance to financial results. Benchmark and compare to appropriate targets; quantify the lost revenue; determine the process that is causing the lost revenue; prioritize the process improvement that has the highest dollar benefit. An established benchmarking system provides more transparency for RCM leaders on the financial performance. It also offers a better foundation for optimizing cash flow, minimizing revenue loss, and enhancing long-term RC performance.
FAQs
Revenue cycle benchmarks are performance standards used to evaluate claims, collections, denials, A/R, and operating efficiency against internal or external targets.
So a meaningful benchmark is not a one-size fits all measurement of specialty, payer mix, service complexity, care setting, and historical performance.
Practices should compare revenue cycle benchmarks by payer to identify differences in denial rates, payment speed, A/R, and collection performance.
Specialty affects coding complexity, authorization requirements, reimbursement patterns, service mix, and medical necessity requirements, which influence RCM performance.
No single benchmark predicts cash performance. Days in A/R, net collection rate, aging, denials, and payment trends provide stronger combined insight.
Benchmark gaps can increase delayed payments, unrecovered revenue, aging A/R, rework costs, and administrative expenses, depending on the affected RCM process.
Common denial causes that reoccur include payer problems, poor follow-up, coding, authorization, documentation, or poor workflow.
Yes. Organizations should use relevant peer benchmarks because specialty, payer mix, care setting, service complexity, and reimbursement structures affect RCM performance.
Outsourcing deserves consideration when benchmark gaps remain persistent, internal capacity is limited, or external expertise offers stronger recovery and operating efficiency.
Billing Care Solutions reviews revenue cycle benchmarks, evaluates the gaps, determines the root cause, and provides guidance for targeted improvements in claims, denials, A/R and collections.
