

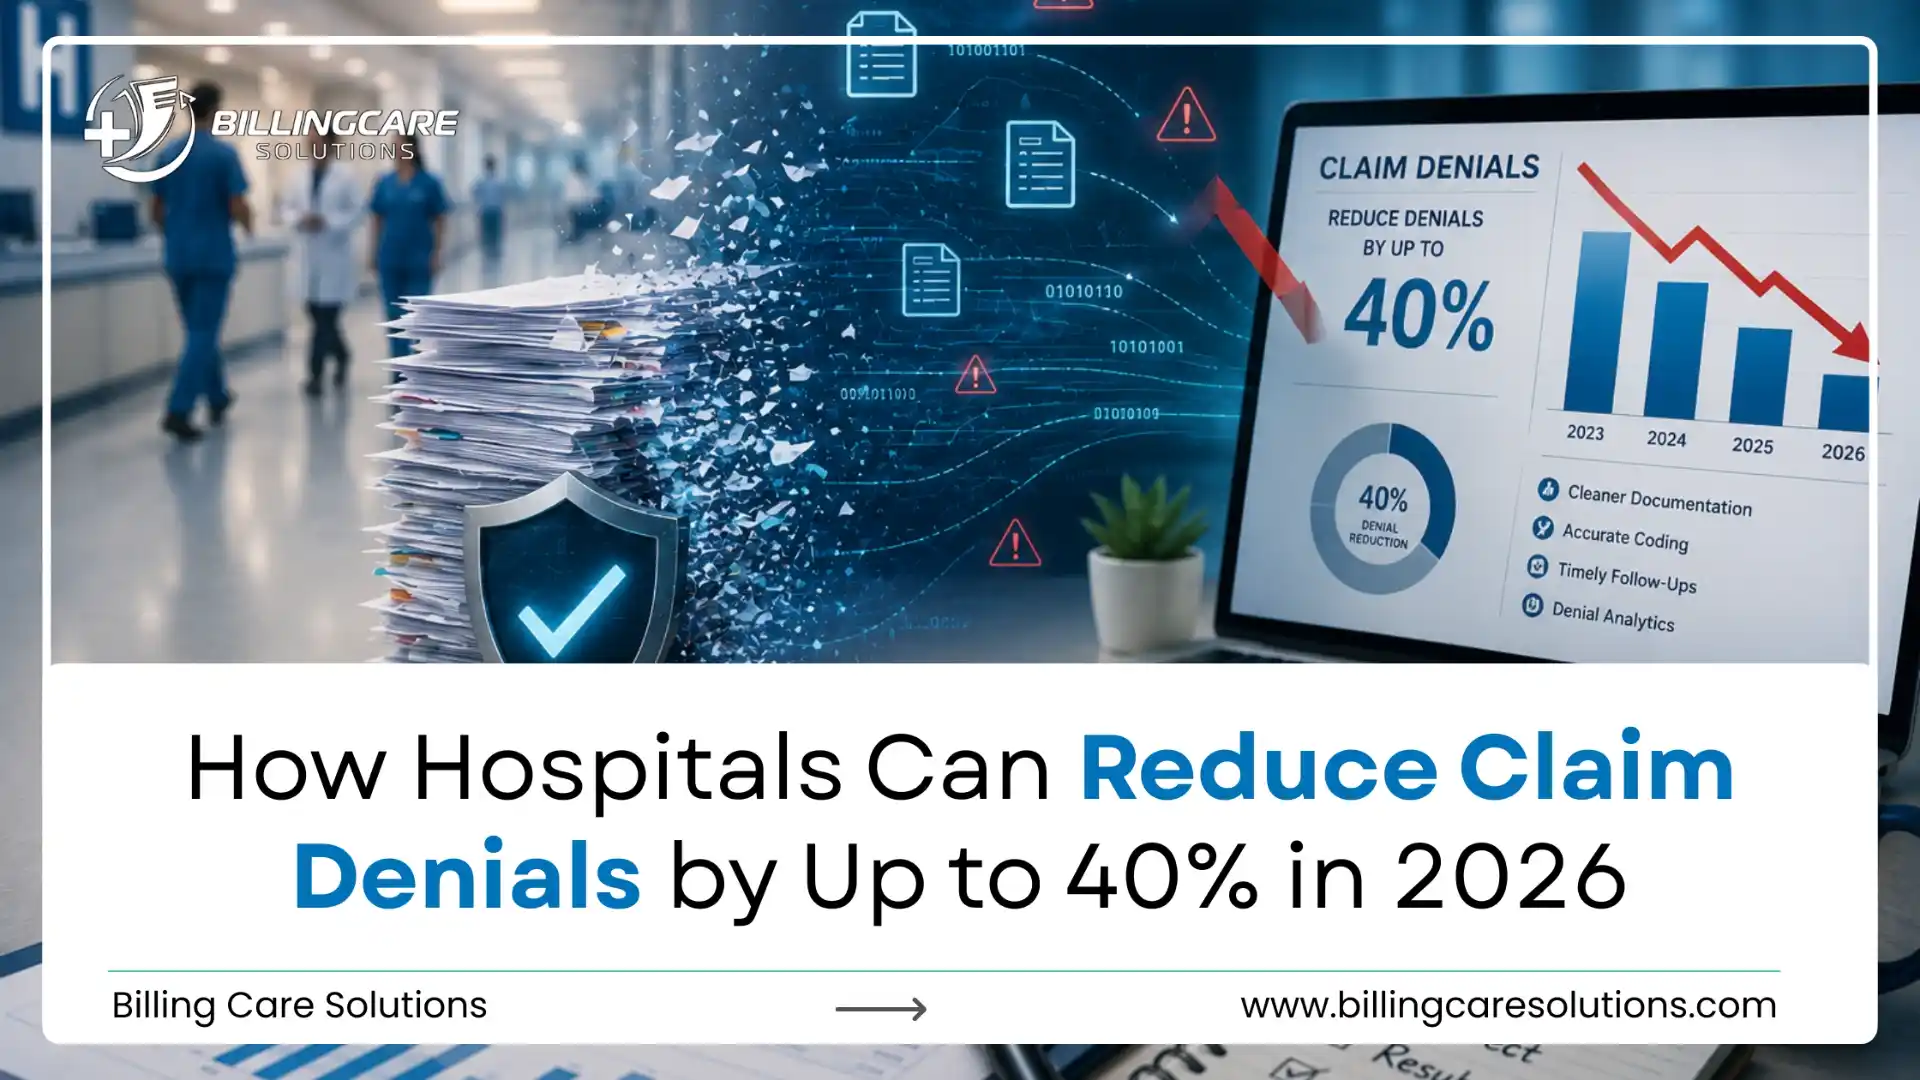
How Hospitals Can Reduce Claim Denials by Up to 40% in 2026
Reduce Hospital Claim Denials with proven billing, coding, and documentation strategies that improve clean claims and protect revenue in 2026.
One major problem that is threatening the financial stability of the healthcare sector is the Hospital Claim Denials. In 2026, Denial of claims is one of the greatest challenges to the financial stability of the healthcare sector. Hospitals suffered from more than $48 billion in denied claims and uncompensated care in 2025 alone, representing a 25 percent year-over-year increase. Every year, the average hospital loses 5 million dollars, or about 5% of its net patient revenue, due to denials.
The numbers for initial denials now stand at 11.6 percent, compared to 10.2 percent three years ago, heading in the wrong direction. More than 41 percent of providers now report denial rates higher than 10 percent, vs. 30 percent in 2022. Doing billing is no longer a headache for the billing department. It’s a strategic necessity for hospital CFOs and revenue cycle managers. This guide will serve as a practical roadmap for minimizing hospital claim denials in 2026.
You’ll discover the root causes of denials, the financial implications of denials on your organization and actionable strategies to avoid denials before they even occur. You will also learn why a reactive approach is no longer feasible and the importance of implementing a proactive denial management strategy that utilizes data to help safeguard your revenue.
The 2026 Reality: Why Hospital Claim Denials Are a Financial Crisis
The numbers are impossible to ignore. Hospital claim denials represent a systemic problem that is getting worse. Consider these 2026 realities:
| Challenge | 2026 Reality | Impact on Hospitals |
|---|---|---|
| Annual Revenue Loss | 48.4 billion dollars in 2025 | 25 percent increase from 2024 |
| Average Hospital Loss | 5 million dollars annually | Roughly 5 percent of net patient revenue |
| Initial Denial Rate | 11.6 percent overall | Up from 10.2 percent just three years ago |
| Providers Above 10% Denial Rate | 41 percent | Up from 30 percent in 2022 |
| Clinical Denials | Increased 8.3 percent year-over-year | Payers scrutinizing medical necessity more aggressively |
| Outpatient Denial Amount | 5,390 dollars average | Significant revenue at risk per denial |
| Inpatient Denial Amount | 565 dollars average | Plus high administrative costs to appeal |
What Is Driving This Crisis?
The ecosystem driving denials has fundamentally shifted. Payers have spent a lot of money on real-time claim rejection tools which can identify even clean-looking claims as payers. Prior authorization guidelines have grown to new service types. As payers implement systems that help identify and match NLP-based clinical notes to billed codes, documentation standards have become increasingly specific.
In the end, the claim’s environment is more complex, more examined and more unforgiving than it was only a couple of years before.
Key drivers include:
Payer Automation: Commercial payers are using AI denial algorithms that are taking more claims for review. There have been 40 percent more denial reason codes than in 2020. This automation results in more hospital claim denials.
Expanded Prior Authorization: More services than ever before covered by prior authorization. In 2025, Medicare Advantage plans alone issued almost 50 million prior authorizations. One of the main reasons for hospital claims getting denied is missed authorizations.
Clinical Documentation Scrutiny: Payers are growing extremely less willing to pay for claims due to clinical criteria gaps. Health systems report missing or non-specific clinical indicators for higher acuity diagnoses. These gaps are the source of avoidable claim denials at the hospital.
Shifting Denial Categories: Denials related to requests for information and medical necessity more than doubled at 70 per cent. Denials for telehealth increased by 84 percent. The outpatient coding denials increased 26 percent year-over-year. Claim denials are heading in new directions at hospitals.
The CFO’s Imperative: Understanding the True Cost of Hospital Claim Denials
What Denials Actually Cost Your Hospital
| Cost Factor | Financial Impact |
|---|---|
| Direct Revenue Loss | 5 percent of net patient revenue on average |
| Denial Rework Cost | 118 dollars per denied claim plus staff time |
| Administrative Burden | 51 to 75 hours per week on denial-related work |
| Cash Flow Impact | Delayed reimbursements of 10 to 15 days per denial |
| Opportunity Cost | Staff time diverted from patient care and growth initiatives |
The Hidden Cost of Ignoring Denials
Costs of denied hospital claims are more than just the loss of revenue. Every rejection has an impact throughout your company.
Rework Costs: All claims denied will be reviewed, corrected and resubmitted. This is taking time from other revenue cycle tasks. Staff dedicate between 51 and 75 hours per week to dealing with hospital claim denials. Staff dedicate an average of 51 to 75 hours per week to claims denial management responsibilities for hospitals.
Delayed Cash Flow: Hospital claim denials take an average of 10-15 days for reimbursement. In large hospitals, every extra day in the accounts receivable is a significant amount of money that is tied up.
Staff Burnout: Due to constant denial, appeal and rework, staff becomes frustrated resulting in staff turnover. The average turnover rate for billing staff is 30 to 40 percent a year.
Reputation Risk: Denials hurt your patient and payor relationship. Patients might get different bills or have a collection call made that will hurt your reputation.
2026 Industry Benchmarks: Where Does Your Hospital Stand?
Understanding your denial rate compared to industry benchmarks is essential for identifying areas for improvement.
Overall Hospital Denial Rates (2024-2025)
| Metric | 2024 | 2025 | Change |
|---|---|---|---|
| Initial Denial Rate (Overall) | 11.4% | 11.6% | +0.2 pp |
| Clinical Initial Denial Rate | 2.4% | 2.6% | +0.2 pp |
| RFI Initial Denial Rate | 3.4% | 3.6% | +0.2 pp |
| Final Denial Rate | 2.5% | 2.7% | +0.2 pp |
Inpatient Denial Rates by Payer (2025)
| Payer Type | Initial Denial Rate | Final Denial Rate |
|---|---|---|
| Medicaid | 44% | 6% |
| Commercial | 21% | 3% |
| Managed Medicaid | 18% | 4% |
| Medicare Advantage | 11% | 5% |
| Medicare (Traditional) | 5% | 1% |
What This Means for Your Hospital?
When denial rates are above these benchmarks, you are losing valuable revenue from hospital claim denials. The difference in initial vs final denials indicates that many claims are paid after appeal. But this is not without its operational expenses, due to administrative burden and cash flow delays.
Commercial denials are more likely to be related to revenue leakage since commercial health plans pay more. The initial denial rate is higher and the final denial rate is over double in Medicare Advantage plans compared to traditional Medicare. This equates to a very high cost of Medicare Advantage hospital claim denials.
The Hidden Costs of Ignoring Denial Prevention
| Cost Category | Without Prevention | With Prevention | Annual Savings |
|---|---|---|---|
| Staff Time on Denial Rework | 51 to 75 hours per week | 20 to 25 hours per week | 100,000 to 150,000 dollars |
| Denial Write-Offs | 2.7 percent final denial rate | 1.5 to 2.0 percent | Significant revenue recovered |
| Appeal Labor Costs | 118 dollars per denied claim | 50 to 60 dollars per denied claim | 50 percent reduction |
| Cash Flow Delay | 10 to 15 days delay | 3 to 5 days delay | Improved working capital |
The Reality:
Denial management has traditionally been reactive and reactive response is an activity that occurs after the claim has been denied. Such a reactive approach is expensive and unfeasible. It is expensive and impractical to respond to hospital claim denials once they have happened, as one expert cautioned.
The big takeaway is that the majority of denials are related to documentation, coding accuracy or eligibility checks prior to claiming, not the bill or AR follow-up after they’re submitted. In absence of upstream root cause issues, hospitals can go on chasing denials, without decreasing their volume.
The Three Layers of Denial Impact
Layer 1: Direct Revenue Loss
Direct revenue loss is the actual dollars that are withheld by the payers. This translates to 2 million dollars in denied claims each year for a 200 million dollar hospital in which 10 percent of claims are denied.
The Problem: The losses build up each year if the denial is not prevented. In 2025, the dollars lost are 48.4 billion, 25 percent more than in 2024.
The Solution: Decrease denials with upstream prevention! Millions of dollars can be recovered with a mere 2-3 percent reduction in denial rate.
Layer 2: Administrative Cost
Administrative cost includes staff time involved in denial review, correction and resubmission. The average amount of time required by clinical staff to provide additional documentation is $118 per denied claim.
The Problem: Denial related work takes up 51-75 hours of staff time a week. This is a considerable expenditure in labour and could be channeled to other uses.
The solution: Automate denial workflows, and prioritize prevention. The smaller the volume of denials, the less administrative time invested.
Layer 3: Strategic Opportunity Cost
Strategic Opportunity Cost is the opportunity cost of the time that would have been used to pursue strategic initiatives. Rather, that time is given to a battle to comb through hospital claim denials.
The Problem: Prolonged time spent on denial issues instead of strategic planning. Claim denials stop growth and innovation in hospitals.
The Solution: Reduce reactive to proactive denial management. Support free leadership time to focus on growth initiatives.
The Ripple Effect: Beyond Financial Loss
Staff Morale and Retention
Denial management puts a strain on billing and revenue cycle personnel. The continuous denial, appeals and rework results in burnout and turnover. Staff work on denial-related work 51 to 75 hours per week. This is unsustainable.
Without Prevention: staff is exhausted from repetitive denial labour. Turnover is high. The information is forgotten.
With Prevention: Staff are involved in purposeful work that has a clear strategy. Turnover is lower. Institutional knowledge is retained.
Audit Risk
There has been a marked rise in the number of payers auditing. CMS audits have more than doubled in the last two years. Denials for requests for information and medical necessity rose 70 percent
With Prevention: Audit risk is very low. Costly penalties and recoupments. Compliance is reactive.
With Prevention: Audit risk is reduced. Compliance is proactive. Documentation is audit-ready.
Credibility and Patient Satisfaction
Denials have the potential to impact patient satisfaction. If patients are receiving bills that are confusing or if they are being contacted about bills for collection, trust is lost. There is a decline in patient satisfaction scores. Online reputation suffers.
Without Prevention: Patients are left with confused bills. Satisfaction scores are lower. Reputation suffers.
With Prevention: Patients get legible, accurate bills. Satisfaction scores are higher. Reputation improves.
Real-World Case Study: From Denial Crisis to Revenue Recovery
Background
- Organization: Regional hospital with 300 beds
- Annual Revenue: 500,000,000 dollars
- Payer Mix: 40 percent Commercial, 30 percent Medicare, 15 percent Medicaid, 15 percent Other
- Challenges: Denial rate climbing to 14 percent, A/R days increasing, staff burned out
Before Denial Prevention Program
| Metric | Performance | Impact |
|---|---|---|
| Initial Denial Rate | 14 percent | 70 million dollars at risk annually |
| Final Denial Rate | 3.2 percent | 16 million dollars written off |
| Net Collection Rate | 88 percent | Significant revenue leakage |
| Days in A/R | 58 days | 22 million dollars locked cash |
| Staff Time on Denials | 75 hours per week | 195,000 dollars in staff time |
The Real Cost of Reactive Denial Management
| Loss Category | Annual Impact |
|---|---|
| Direct Revenue Loss | 70 million dollars at risk; 16 million dollars written off |
| Rework Costs | 118 dollars × 15,000 denials = 1.77 million dollars |
| Staff Time | 75 hours/week × 65 dollars/hour × 52 weeks = 253,500 dollars |
| Cash Flow Impact | 22 million dollars locked in A/R |
| Total Annual Loss | 18 million dollars or more |
The Turning Point
The hospital implemented a comprehensive denial prevention program including:
- Pre-bill clinical documentation review
- AI-powered denial prediction
- Real-time eligibility verification
- Automated prior authorization tracking
- Payer-specific coding guidance
- Cross-functional denial steering committee
After Denial Prevention Program
| Metric | Performance | Improvement |
|---|---|---|
| Initial Denial Rate | 8 percent | 6 percent reduction |
| Final Denial Rate | 1.8 percent | 1.4 percent reduction |
| Net Collection Rate | 94 percent | 6 percent improvement |
| Days in A/R | 38 days | 20 days reduction |
| Staff Time on Denials | 30 hours per week | 45 hours per week reduction |
Financial Impact
| Area | Before | After | Annual Gain |
|---|---|---|---|
| Revenue Lost to Denials | 70 million dollars at risk | 40 million dollars at risk | 30 million dollars recovered |
| Revenue Written Off | 16 million dollars | 9 million dollars | 7 million dollars recovered |
| Rework Costs | 1.77 million dollars | 950,000 dollars | 820,000 dollars saved |
| Total Annual Benefit | – | – | 37.8 million dollars |
| Investment in Prevention | – | – | (1.5 million dollars) |
| Net Annual Benefit | – | – | 36.3 million dollars |
The Cycle of Failure vs The Prevention Virtuous Cycle
The Cycle of Failure Without Denial Prevention
- Denials Increase
- Staff spends more time on rework
- Less time for prevention
- More denials occur
- Staff becomes burned out
- Turnover increases
- Quality declines further
- Audit risk increases
- Revenue continues to leak
The Prevention Virtuous Cycle
- Denials are prevented upstream
- Staff spends less time on rework
- More time for prevention
- Fewer denials occur
- Staff stays engaged
- Retention improves
- Quality improves
- Audit risk decreases
- Revenue is protected and grows
5 Strategies to Reduce Hospital Claim Denials in 2026
Strategy 1: Strengthen Patient Registration and Eligibility Verification
One of the most common causes of claim denials is missing or incorrect patient information. Denial due to errors in patient names, dates of birth, insurance information and identification number.
The Solution: Ensure eligibility is verified at registration time! Check coverage prior to services. Recheck eligibility 24 hours prior to discharge to ensure that there are no coverage changes during the stay.
The Impact: minimises registration denial due to incorrect registration data. Improves collection rates. Enhances patient satisfaction.
Strategy 2: Improve Clinical Documentation Quality
A significant number of denials are due to missing or unclear clinical documentation. More and more payers are refusing claims due to clinical criteria gaps. Some of the most frequent claim denial reasons are due to missing or ambiguous clinical data for high acuity diagnoses.
The solution: Collaborate with medical staff to set up documentation standards. Explain the meaning of complete documentation for various kinds of entries. Ensure severity of symptoms is recorded. Establish daily chart rounds to check for missing information, and to identify patients’ charts.
The impact: Saves clinical denials. Supports medical necessity. Improves coding accuracy.
Strategy 3: Address Prior Authorization Gaps
One of the fastest growing types of denial is prior authorization denial. In 2025, Medicare Advantage plans delivered almost 50 million prior authorizations in isolation. Denials for requests for information and/or medical necessity jumped 70 percent .
The Solution: Keep monitoring the authorization needs per service and per payer. Use automated prior authorization tracking. Integrate workflows with build triggers to ensure that authorizations are requested prior to providing services.
The impact: Reduces previous authorization denials. Speeds up reimbursement. Reduces administrative burden.
Strategy 4: Use AI-Powered Denial Prediction
AI can scan claims prior to submission and recognize which claims are likely to be denied. This enables staff to deal with problems proactively instead of reactively.
The solution: Develop AI denial prediction tools. For submission, score claims for risk. Get the focus of the staff on claims that are more likely to be denied.
The impact: Decreases preventable denials. Improves staff efficiency. Raises the number of clean claims.
Strategy 5: Conduct Pre-Bill Audits
Submissions can be prevented from many denials by reviewing claims prior to submission. Identify documentation gaps, coding errors, and other issues that can lead to denials from before they occur with pre-bill audits.
The Solution: Pre-bill auditing for the high-risk claims. Implement pre-bill review programs using technology, physician direction, to identify documentation gaps prior to submission.
The Impact: Lowers denials. Improves claim quality. Enhances first pass resolution rates.
Why 2026 Demands Proactive Denial Prevention
The Five Forces Reshaping Hospital Denials
1. Payer Automation Has Increased
Payers have spent a lot of money to create automated systems that can reject claims on the fly, even if it seems to be a clean claim. The number of denial reason codes has risen from 40% in 2020.
The Challenge: Traditional denial management is not capable of catching automated payer scrutiny.
The Solution: Proactive denial prevention with the help of AI-powered tools to discover and resolve problems in advance.
2. Prior Authorization Requirements Have Expanded
There are more services now required to be covered by prior authorization than ever before. In 2026, Medicare Advantage plans alone made almost 50 million prior authorizations.
The problem: Manual prior authorisations are not scalable enough with the growing needs.
The Solution: Automated Prior Authorization Tracking and Proactive Prior Authorization Identification.
3. Clinical Documentation Scrutiny Has Intensified
Claims are more and more denied due to clinical criteria gaps. The number of denials for requests for information or medical necessity increased 70 percent.
The Challenge: Clinical documentation doesn’t always contain the information needed to pay the claim.
The Solution: Enhanced clinical documentation quality and pre-bill audits.
4. Denial Categories Are Shifting
Year over year, outpatient coding denials rose by 26 percent. Denials for telehealth services increased 84 percent .
The Problem: Hospitals are not staying up to date on new denial categories.
The Solution: High growth denial categories are systematically denied and prevented.
5. Revenue Leakage Is Growing
In 2025, hospitals faced over $48 billion in denied claims, marking a 25 percent rise from the previous year.
The problem is that this trend cannot be reversed with Reactive denial management.
The Solution: Integrated Denial Prevention Program
The Solution: Integrated Denial Prevention Program
Problem 1: Repeated Denials
Traditional Response: Address the denial one at a time, typically without identifying the underlying cause.
The Comprehensive Solution: Root cause analysis to find patterns. The most common denials and the preventive workflows to avoid them. Provider-specific training in documentation best practices.
Problem 2: Undetected Documentation Gaps
Traditional Response: Identify gaps after claims are denied.
Comprehensive Solution: Pre-bill clinical documentation review. Instantaneous notification of missing information. Medical indicators to identify possible problems.
Problem 3: Missed Prior Authorizations
Traditional Response: Respond to denials when the authorizations were not met.
The complete solution: Automated authorization monitoring. Workflow triggers to be sure to get authorization. Payer-specific authorization requirements.
Problem 4: Inefficient Appeal Processes
Traditional Response: Inconsistencies in analysis, inconsistent appeals with varying success rates.
Comprehensive Solution: Structured appeals process with clear escalation paths. Identification of appealable denials based on data. Performance monitoring for ongoing enhancement.
Problem 5: No Visibility Into Denial Trends
Traditional Response: Respond to a single denial without identifying patterns.
The comprehensive solution: Denial analytics dashboard. Payer, service line, and reason trend analysis. Preventive recommendations.
The 2026 Hospital Leader’s Action Plan
Immediate Next Steps
Week 1: Assessment
- Audit your current denial rate and compare to benchmarks
- Identify your top denial reasons by payer and service line
- Calculate your revenue leakage from denials
- Assess your current denial management processes
Week 2: Analysis
- Identify root causes of your most common denials
- Evaluate your documentation and coding quality
- Assess your prior authorization processes
- Identify gaps in eligibility verification
Week 3: Decision
- Define your denial prevention priorities
- Evaluate technology solutions for denial prediction
- Develop a prevention-focused strategy
- Establish clear KPIs and targets
Week 4: Implementation
- Implement pre-bill review processes
- Deploy technology solutions
- Train staff on new workflows
- Establish regular monitoring and reporting
Billing Care Solutions Your Denial Prevention Partner
Billing Care Solutions has been well aware of the devastating effect when a claim is denied at the hospital. We have already assisted hospitals in substantially decreasing denials of hospital claims with 17 years of experience in revenue cycle management. We’ve made our clients hundreds of millions of dollars back in lost revenue. We are not reactive, we are proactive. We are working on root causes prior to claims. This will prevent claims from being denied in the first place at the hospital. Our in-depth denial prevention program features clinical documentation review for pre-bill denial prediction with AI capabilities. We also have eligibility checks and prior authorization tracking in real-time.
An analysis of hospital claim denials by payer and service line. This assists us to recognise trends and make targeted interventions. Our skilled team collaborates with your team to create robust prevention capacities. Working with Billing Care Solutions means you have a staff that is committed to safeguarding your revenue against hospital claim denials. We ease your administrative load and aid your strategic development. Come to us for support to turn denial management into a tool for strength. Call us now to begin your journey towards denial prevention.
Conclusion
In 2026, one of the biggest financial challenges for healthcare organizations could be hospital claim denials. The payouts have been denied by insurance providers, and the amount lost is in excess of 48 billion dollars last year. Reactive denial management is not enough. Payers are automated their examination process. There is an increase in prior authorisation. There has been a move towards closer clinical documentation inspection.
This is where proactive denial prevention comes in. Hospitals that implement a proactive approach to prevention, rather than reactive appeals, stand to gain up to 40 to 50 percent fewer hospital claim denials and millions in lost revenue. It’s never too late to begin, and sometimes it’s even better if you do it today. Billing Care Solutions is here to help you turn denial management from a stressful to a supportive experience.
Frequently Asked Questions
Claim denial by a hospital means the claim was denied by the health insurance company. This can be caused by coding, documentation and/or lack of prior authorization.
In 2025, hospitals saw denied claims totaling over 48 billion dollars. This is a considerable 25 per cent growth over the previous year.
The average denial rate is now 11.6 percent in hospitals. Denials rates are now over 10 percent for more than 41 percent of providers.
Documentation problems, coding errors and eligibility are the most common reasons for denials. These problems arise prior to the claims being submitted to payers.
Pre-bill reviews, enhanced documentation, and AI-driven prediction are some ways that hospitals can minimize denials. There are also many common denials that can be avoided with real-time eligibility verification.
Denial rates of less than 5 percent are the goal for hospitals. The best in class has a 3 percent or lower denial rate.
On average, each denied claim will take an average of 118 dollars to redo. This involves staff time needed to review, correct and resubmit to the payer.
Initial denial rates are those claims that were denied on the first submission. Final denial rates are for claims denied after all appeals have been finalized.
Medicaid is the highest with 44 percent denials. The 21 percent comes from commercial plans. Medicare Advantage rejects at double the rate of traditional Medicare.
Proactive denial prevention takes place before claims are submitted. It emphasizes the quality of documentation, accuracy of coding, eligibility verification and the tracking of prior authorization.
